Fitxategi:Symmetricwave2.png

Bereizmen handikoa ((1.811 × 1.356 pixel, fitxategiaren tamaina: 540 KB, MIME mota: image/png))
Fitxategi hau Wikimedia Commonsekoa da. Hango deskribapen orriko informazioa behean duzu. |

|
Irudi hau birsortu beharko litzateke SVG irudi bektorial moduan. Honek abantaila asko ematen ditu, ikus Commons:Media for cleanup (ingelesez) informazio gehiagorako. Irudi honen SVG bertsioa eskuragarri badago, mesedez Commonsera igo. Igo ostean, ordezkatu txantiloi hau txantiloi honegatik {{vector version available|irudiaren izen berria.svg}} irudi honetan.
|
Laburpena
| Deskribapena |
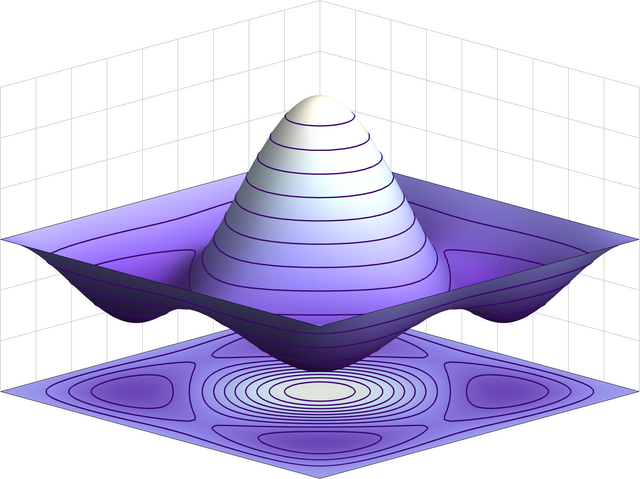
English: Symmetric wavefunction for a (bosonic) 2-particle state in an infinite square well potential. |
| Jatorria | Norberak egina |
| Egilea | TimothyRias |
Lizentzia
- Askea zara:
- partekatzeko – lana kopiatzeko, banatzeko eta bidaltzeko
- birnahasteko – lana moldatzeko
- Ondorengo baldintzen pean:
- eskuduntza – Egiletza behar bezala aitortu behar duzu, lizentzia ikusteko esteka gehitu, eta ea aldaketak egin diren aipatu. Era egokian egin behar duzu hori guztia, baina inola ere ez egileak zure lana edo zure erabilera babesten duela irudikatuz.
Laburpena
This 3D graph shows the wavefunction for the 2-particle bosonic state for the one dimensional infinite square well at the same energy as the fermionic 2-particle groundstate. (See for example D.J. Griffiths, Introduction to quantum mechanics, Prentice Hall , 1995, section 5.1.1) The picture was created using Mathematica 6.0 using the following code:
$Assumptions = {n \[Element] Integers, m \[Element] Integers};
f[n_, x_] := Sqrt[2] Sin[n \[Pi] x];
s[n_, m_] :=
 Function[{x, y}, (f[n, x] f[m, y] + f[n, y] f[m, x])/Sqrt[2]];
swave2 = Plot3D[Evaluate[-s[3, 1][x, y]], {x, 0, 1}, {y, 0, 1},
  PlotPoints -> 35,
  PlotRange -> {-2.5, 3.5},
  MeshFunctions -> {#3 &},
  MeshStyle ->
   Directive[ColorData["DeepSeaColors"][.1], Thickness[.002]],
  Mesh -> 10,
  ColorFunction -> "LakeColors",
  BoxRatios -> {1, 1, .7},
  Boxed -> False,
  Axes -> False];
sgroundplot = Plot3D[-3, {x, 0, 1}, {y, 0, 1},
  MeshFunctions -> {s[1, 3][#1, #2] &},
  Mesh -> 10,
  MeshStyle ->
   Directive[ColorData["DeepSeaColors"][.1], Thickness[.002]],
  PlotPoints -> 50,
  ColorFunction -> (ColorData["LakeColors"][(-s[1, 3][#1, #2] + 2.5)/
      6] &)];
swave3 = Show[{swave2, sgroundplot},
 PlotRange -> {{0, 1}, {0, 1}, {-3, 3}},
 Axes -> None,
 PlotRangePadding -> None,
 ImagePadding -> 1,
 FaceGrids -> {
   {{-1, 0, 0}, {Table[i, {i, 0, 1, 1/9}],
     Table[i, {i, -3, 3, 1}]}},
   {{0, -1, 0}, {Table[i, {i, 0, 1, 1/9}], Table[i, {i, -3, 3, 1}]}}
   },
 ViewPoint -> 1000 {5, 5, 2},
 ViewVertical -> {0, 0, 1},
 ViewCenter -> {.5, .5, 0},
 ImageSize -> 600]
Export["Symmetricwave2.png", swave3, "PNG"]
Fitxategiaren historia
Data/orduan klik egin fitxategiak orduan zuen itxura ikusteko.
| Data/Ordua | Iruditxoa | Neurriak | Erabiltzailea | Iruzkina | |
|---|---|---|---|---|---|
| oraingoa | 17:52, 19 otsaila 2024 | | 1.811 × 1.356 (540 KB) | Jähmefyysikko | Antialiasing and higher resolution |
| 15:18, 15 urria 2008 |  | 600 × 450 (79 KB) | TimothyRias | {{Information |Description= |Source= |Date= |Author= |Permission= |other_versions= }} Category:Physics plots | |
| 16:52, 7 urria 2008 |  | 360 × 286 (25 KB) | TimothyRias | {{Information |Description={{en|1=Symmetric wavefunction}} |Source=Own work by uploader |Author=TimothyRias |Date= |Permission= |other_versions= }} <!--{{ImageUpload|full}}--> |
Irudira dakarten loturak
Hurrengo orrialdeek dute fitxategi honetarako lotura:
Fitxategiaren erabilera orokorra
Hurrengo beste wikiek fitxategi hau darabilte:
- ar.wikipedia.org proiektuan duen erabilera
- ast.wikipedia.org proiektuan duen erabilera
- ca.wikipedia.org proiektuan duen erabilera
- da.wikipedia.org proiektuan duen erabilera
- en.wikipedia.org proiektuan duen erabilera
- fa.wikipedia.org proiektuan duen erabilera
- ga.wikipedia.org proiektuan duen erabilera
- hy.wikipedia.org proiektuan duen erabilera
- ja.wikipedia.org proiektuan duen erabilera
- ko.wikipedia.org proiektuan duen erabilera
- pa.wikipedia.org proiektuan duen erabilera
- pl.wikipedia.org proiektuan duen erabilera
- ro.wikipedia.org proiektuan duen erabilera
- ru.wikipedia.org proiektuan duen erabilera
- sr.wikipedia.org proiektuan duen erabilera
- th.wikipedia.org proiektuan duen erabilera
- uk.wikipedia.org proiektuan duen erabilera
- uz.wikipedia.org proiektuan duen erabilera
- www.wikidata.org proiektuan duen erabilera
- zh-yue.wikipedia.org proiektuan duen erabilera
- zh.wikipedia.org proiektuan duen erabilera