Fitxategi:Decline curve analysis software image of exponential decline - hyperbolic decline.jpg

Bereizmen handikoa ((1.408 × 1.050 pixel, fitxategiaren tamaina: 665 KB, MIME mota: image/jpeg))
Fitxategi hau Wikimedia Commonsekoa da. Hango deskribapen orriko informazioa behean duzu. |
Laburpena
| Deskribapena |
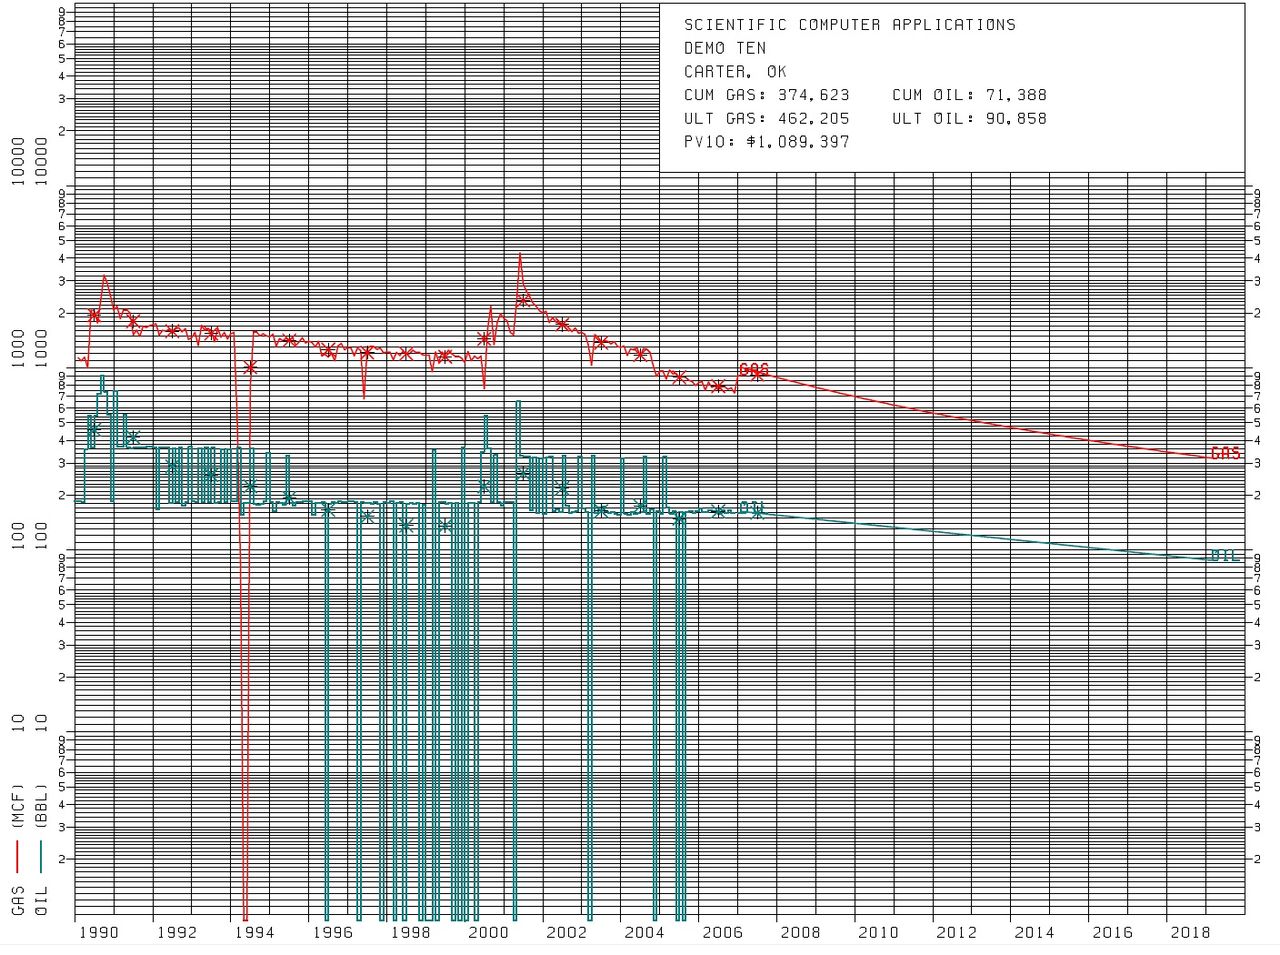
English: Decline curve generated by decline curve analysis software, utilized in oil economics and petroleum economics to indicate the depletion of oil & gas in a Petroleum reservoir.
The Y axis is a semi log scale, indicating the rate of Oil depletion (green line), and gas depletion (red line). The X axis is a coordinate scale, indicating time in years and displays the production decline curve. The top red line is the gas decline curve, which is a hyperbolic decline curve. Gas is measured in MCF (Thousand cubic feet). The lower Blue line is the oil decline curve, which is an exponential decline curve. Oil is measured in BBL, or Oil barrels. Data is from actual sales, not pumped production. The dips to zero indicate there were no sales that month, likely because the Oil well did not produce a full tank, and thus was not worth a visit from a Tank truck. The upper right Legend (map) displays CUM, which is the cumulative gas or oil produced. ULT is the ultimate recovery projected for the well. Pv10 is the Discounted present value of 10%, which is the Future value of the remaining lease, valued for this oil well at $1.089 M USD. |
||
| Data | |||
| Jatorria | Sent to me personally | ||
| Egilea | Richard Banks | ||
| Lizentzia (Fitxategi hau berrerabiltzen) |
|

- Other information
Lizentzia

|
The copyright holder of this file, Richard Banks, allows anyone to use it for any purpose, provided that the copyright holder is properly attributed. Redistribution, derivative work, commercial use, and all other use is permitted. |
Aitortu:
Screenshot image generated by Forecasting, Economics and Graphics System (FEGS) decline curve analysis software. [1]
|
Jatorrizko igoera erregistroa
Transferred from en.wikipedia to Commons using For the Common Good.
| Data/Ordua | Neurriak | Erabiltzailea | Iruzkina |
|---|---|---|---|
| 05:08, 16 May 2012 | 1,408 × 1,050 (681,147 bytes) | w:en:RainmakerUSA (eztabaida | ekarpenak) | Decline curve generated by decline curve analysis software, utilized in [[oil economics]] and [[petroleum economics]] to indicate the depletion of oil & gas in a [[Petroleum reservoir]]. The Y axis is a semi log scale, indicating the rate of [[Oil de... |

|
Irudi honetako kategoriak berretsi behar dira. Saiatu!
|
Fitxategiaren historia
Data/orduan klik egin fitxategiak orduan zuen itxura ikusteko.
| Data/Ordua | Iruditxoa | Neurriak | Erabiltzailea | Iruzkina | |
|---|---|---|---|---|---|
| oraingoa | 02:04, 12 uztaila 2014 | | 1.408 × 1.050 (665 KB) | Josve05a | Transferred from en.wikipedia: see original upload log above |
Irudira dakarten loturak
Hurrengo orrialdeek dute fitxategi honetarako lotura:
Fitxategiaren erabilera orokorra
Hurrengo beste wikiek fitxategi hau darabilte:
- en.wikipedia.org proiektuan duen erabilera
- es.wikipedia.org proiektuan duen erabilera
- fr.wikipedia.org proiektuan duen erabilera
- ja.wikipedia.org proiektuan duen erabilera
- zh.wikipedia.org proiektuan duen erabilera