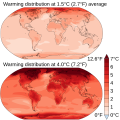
Fitxategi:Projected Change in Temperatures.svg

SVG fitxategi honen PNG aurreikuspenaren tamaina: 600 × 600 pixel. Bestelako bereizmenak: 240 × 240 pixel | 480 × 480 pixel | 768 × 768 pixel | 1.024 × 1.024 pixel | 2.048 × 2.048 pixel | 960 × 960 pixel.
Bereizmen handikoa (SVG fitxategia, nominaldi 960 × 960 pixel, fitxategiaren tamaina: 1,07 MB)
Fitxategiaren historia
Data/orduan klik egin fitxategiak orduan zuen itxura ikusteko.
| Data/Ordua | Iruditxoa | Neurriak | Erabiltzailea | Iruzkina | |
|---|---|---|---|---|---|
| oraingoa | 13:43, 1 abuztua 2023 |  | 960 × 960 (1,07 MB) | Jirka Dl | File uploaded using svgtranslate tool (https://svgtranslate.toolforge.org/). Added translation for cs. |
| 21:55, 18 abuztua 2021 |  | 960 × 960 (1,07 MB) | Efbrazil | Updated to AR6 | |
| 18:00, 13 maiatza 2020 |  | 960 × 960 (1,74 MB) | Nyq | Decapitalized common nouns | |
| 20:25, 30 martxoa 2020 |  | 960 × 960 (1,74 MB) | Efbrazil | Very fiddly tweak, changed positioning / size of CO2 subscript | |
| 19:17, 30 martxoa 2020 |  | 960 × 960 (1,74 MB) | Efbrazil | Dropping space between RCP and number as per review | |
| 20:04, 9 martxoa 2020 |  | 960 × 960 (1,74 MB) | Efbrazil | Uploaded own work with UploadWizard |
Irudira dakarten loturak
Hurrengo orrialdeek dute fitxategi honetarako lotura:
Fitxategiaren erabilera orokorra
Hurrengo beste wikiek fitxategi hau darabilte:
- ar.wikipedia.org proiektuan duen erabilera
- az.wikipedia.org proiektuan duen erabilera
- bn.wikipedia.org proiektuan duen erabilera
- en.wikipedia.org proiektuan duen erabilera
- es.wikipedia.org proiektuan duen erabilera
- fa.wikipedia.org proiektuan duen erabilera
- fr.wikipedia.org proiektuan duen erabilera
- it.wikipedia.org proiektuan duen erabilera
- kn.wikipedia.org proiektuan duen erabilera
- ko.wikipedia.org proiektuan duen erabilera
- mk.wikipedia.org proiektuan duen erabilera
- pt.wikipedia.org proiektuan duen erabilera
- rw.wikipedia.org proiektuan duen erabilera
- tr.wikipedia.org proiektuan duen erabilera
- zh.wikipedia.org proiektuan duen erabilera
