Fitxategi:MER Star Plot.gif
MER_Star_Plot.gif ((560 × 438 pixel, fitxategiaren tamaina: 28 KB, MIME mota: image/gif))
Fitxategiaren historia
Data/orduan klik egin fitxategiak orduan zuen itxura ikusteko.
| Data/Ordua | Iruditxoa | Neurriak | Erabiltzailea | Iruzkina | |
|---|---|---|---|---|---|
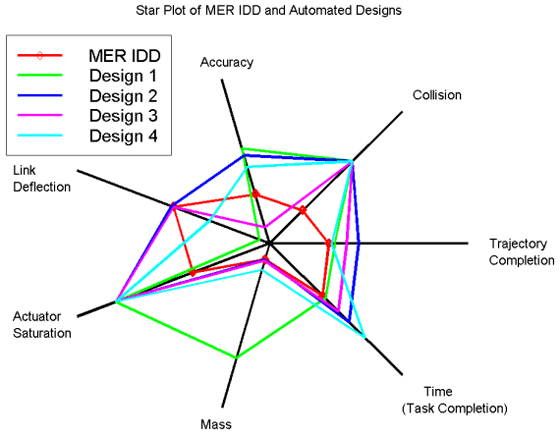
| oraingoa | 00:51, 15 urria 2008 |  | 560 × 438 (28 KB) | Mdd | {{Information |Description={{en|1=In this star plot, the center represents the most desirable results. The red line represents the handcrafted MER IDD, and is used for comparison and validation of the approach. This graph illustrates the fact that improv |
Irudira dakarten loturak
Hurrengo orrialdeek dute fitxategi honetarako lotura:
Fitxategiaren erabilera orokorra
Hurrengo beste wikiek fitxategi hau darabilte:
- en.wikipedia.org proiektuan duen erabilera
- en.wikiversity.org proiektuan duen erabilera
- et.wikipedia.org proiektuan duen erabilera
- fa.wikipedia.org proiektuan duen erabilera
- hu.wikipedia.org proiektuan duen erabilera
- it.wikipedia.org proiektuan duen erabilera
- ja.wikipedia.org proiektuan duen erabilera
- no.wikipedia.org proiektuan duen erabilera
- pt.wikipedia.org proiektuan duen erabilera
- ru.wikipedia.org proiektuan duen erabilera
- uk.wikipedia.org proiektuan duen erabilera


