Fitxategi:IQ curve.svg

SVG fitxategi honen PNG aurreikuspenaren tamaina: 600 × 480 pixel. Bestelako bereizmenak: 300 × 240 pixel | 960 × 768 pixel | 1.280 × 1.024 pixel | 2.560 × 2.048 pixel.
Bereizmen handikoa (SVG fitxategia, nominaldi 600 × 480 pixel, fitxategiaren tamaina: 9 KB)
Fitxategi hau Wikimedia Commonsekoa da. Hango deskribapen orriko informazioa behean duzu. |
Laburpena
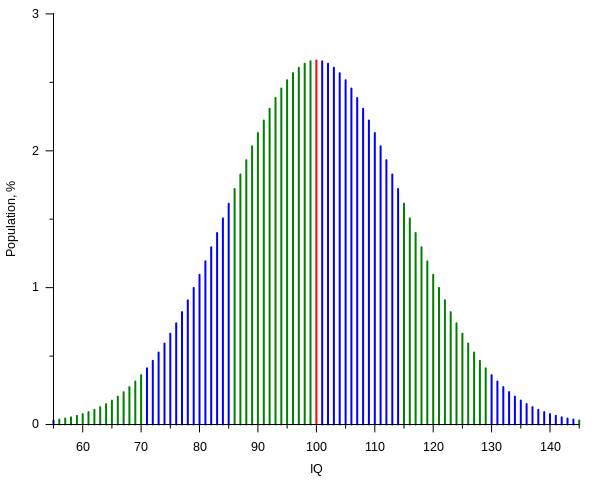
| Deskribapena | Current IQ tests typically have standard scores such that the mean score is 100 with each standard deviation from the mean counting for 15 IQ points.[1] The plot shows, assuming that such scores have a normal distribution, the percentage of people getting a score versus the score itself, from 55 to 145 IQ, that is over a span of six standard deviations. Spans are represented with different colors for each standard deviation above or below the mean. The plot was created with the following gnuplot code: |
| SVG genesis | Fitxategi hau (bektore-irudia) hau Gnuplot-ekin sortu da . |
| Iturburu kode | Gnuplot codeset terminal svg name 'IQ_curve' size 600,480 font ',10' rounded
set output 'IQ_curve.svg'
mu = 100.0
sigma = 15.0
from = 55
to = 145
# Normal distribution:
# (continuos normalization approximation, good to ~10 digits in this case)
P(x) = exp(-(x - mu)**2 / (2 * sigma**2)) / (sqrt(2 * pi) * sigma) * 100
# By sigma intervals:
oddsi(x) = (int(abs(x - mu) / sigma) % 2) ^ (x < mu)
Pm(x) = (x == mu) ? P(x) : 1/0 # sample at mu
Po(x) = ( oddsi(x) && (x != mu)) ? P(x) : 1/0 # samples in odd sigma intervals
Pe(x) = (!oddsi(x) && (x != mu)) ? P(x) : 1/0 # samples in even sigma intervals
set key off
set border 3
set xlabel 'IQ'
set xtics 10 out nomirror
set mxtics 2
set ylabel 'Population, %'
set ytics 1 out nomirror
set mytics 2
set samples (to - from + 1)
set style function impulses
plot [x = from:to] \
Pm(x) lw 2, \
Po(x) lw 2, \
Pe(x) lw 2
|
| Data | |
| Jatorria | Norberak egina |
| Egilea | Alessio Damato, Mikhail Ryazanov |
- ↑ Kaufman, A.S. (2009) IQ Testing 101, New York (NY): Springer Publishing, pp. 104−109 ISBN: 978-0-8261-0629-2.
Lizentzia
Nik, lan honen egileak, argitaratzen dut ondorengo lizentzia hauen pean:

|
Baimena duzu dokumentu hau kopiatu, banatu edo/eta aldatzeko GNU Free Documentation License baldintzapean, Free Software Foundationek argitaratutako 1.2 edo ondorengo bertsioan; sekzio aldaezinik gabe, azaleko testurik gabe, eta atzeko azaleko testurik gabe. Lizentziaren kopia dago GNU Free Documentation License izenburudun atalean. |
| Fitxategi hau Creative Commons Attribution-Share Alike 3.0 Unported lizentziapean dago. | ||
| ||
| This licensing tag was added to this file as part of the GFDL licensing update. |
This file is licensed under the Creative Commons Attribution-Share Alike 2.5 Generic, 2.0 Generic and 1.0 Generic license.
- Askea zara:
- partekatzeko – lana kopiatzeko, banatzeko eta bidaltzeko
- birnahasteko – lana moldatzeko
- Ondorengo baldintzen pean:
- eskuduntza – Egiletza behar bezala aitortu behar duzu, lizentzia ikusteko esteka gehitu, eta ea aldaketak egin diren aipatu. Era egokian egin behar duzu hori guztia, baina inola ere ez egileak zure lana edo zure erabilera babesten duela irudikatuz.
- berdin partekatu – Lan honetan oinarrituta edo aldatuta berria eraikitzen baduzu, emaitza lana hau bezalako lizentzia batekin argitaratu behar duzu.
Nahiago duzun lizentzia erabil dezakezu.
Fitxategiaren historia
Data/orduan klik egin fitxategiak orduan zuen itxura ikusteko.
| Data/Ordua | Iruditxoa | Neurriak | Erabiltzailea | Iruzkina | |
|---|---|---|---|---|---|
| oraingoa | 01:11, 27 azaroa 2020 | | 600 × 480 (9 KB) | Paranaja | Reverted to version as of 21:27, 2 November 2012 (UTC) |
| 23:27, 2 azaroa 2012 |  | 600 × 480 (9 KB) | Mikhail Ryazanov | IQ values are now integers; gnuplot-only approach | |
| 11:20, 6 abendua 2006 |  | 600 × 480 (12 KB) | Alejo2083 | {{Information |Description= The IQ test is made so that most of the people will score 100 and the distribution will have the shape of a Gaussian function, with a standard deviation of 15. The plot shows the percentage of people getting a score versus the |
Irudira dakarten loturak
Hurrengo orrialdeek dute fitxategi honetarako lotura:
Fitxategiaren erabilera orokorra
Hurrengo beste wikiek fitxategi hau darabilte:
- ar.wikipedia.org proiektuan duen erabilera
- ast.wikipedia.org proiektuan duen erabilera
- az.wikipedia.org proiektuan duen erabilera
- ba.wikipedia.org proiektuan duen erabilera
- be-tarask.wikipedia.org proiektuan duen erabilera
- be.wikipedia.org proiektuan duen erabilera
- ca.wikipedia.org proiektuan duen erabilera
- cs.wikipedia.org proiektuan duen erabilera
- da.wikipedia.org proiektuan duen erabilera
- de.wikipedia.org proiektuan duen erabilera
- Intelligenzquotient
- Normwert
- Wikipedia:WikiProjekt Psychologie/Archiv
- Benutzer:SonniWP/Hochbegabung
- Kritik am Intelligenzbegriff
- The Bell Curve
- Benutzer:Rainbowfish/Bilder
- Quantitative Psychologie
- Intelligenzprofil
- Benutzer:LauM Architektur/Babel
- Benutzer:LauM Architektur/Babel/Überdurchschnittlicher IQ
- de.wikibooks.org proiektuan duen erabilera
- Elementarwissen medizinische Psychologie und medizinische Soziologie: Theoretisch-psychologische Grundlagen
- Elementarwissen medizinische Psychologie und medizinische Soziologie/ Druckversion
- Elementarwissen medizinische Psychologie und medizinische Soziologie/ Test
- Benutzer:OnkelDagobert:Wikilinks:Psychologie
- de.wikiversity.org proiektuan duen erabilera
- en.wikipedia.org proiektuan duen erabilera
- User:Michael Hardy
- User:Robinh
- User:Itsnotvalid
- User:M.e
- User:Quandaryus
- User:Astronouth7303
- User:Mattman723
- User:Iothiania
- User:Octalc0de
- Portal:Mathematics/Featured picture archive
- User:Dirknachbar
- User talk:BlaiseFEgan
- User:Albatross2147
- User:Klortho
- User:Kvasir
- User:Spellcheck
- User:Heptadecagram
- User:Patrick1982
- User:NeonMerlin/boxes
- User:Cswrye
Ikus fitxategi honen erabilpen global gehiago.