Fitxategi:Dewpoint.jpg
Ez dago bereizmen handiagorik.
Dewpoint.jpg ((400 × 400 pixel, fitxategiaren tamaina: 28 KB, MIME mota: image/jpeg))
Fitxategi hau Wikimedia Commonsekoa da. Hango deskribapen orriko informazioa behean duzu. |
Laburpena
| Deskribapena |
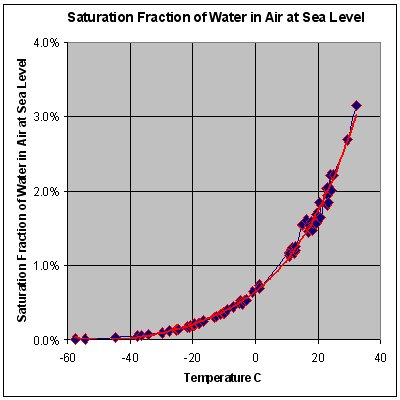
English: Graph of atmospheric dewpoints across a range of temperatures. It was created on August 1, 2004 based on data from the NOAA weather balloon sounding database. |
| Data | |
| Jatorria | Norberak egina (Transferred from en.wikipedia to Commons by Teratornis using CommonsHelper.) |
| Egilea | GregBenson at ingelesa Wikipedia |


Lizentzia
GregBenson from en.wikipedia.org, lan honen egileak, argitaratu du edo argitaratzen du ondorengo lizentzia pean:
| Fitxategi hau Creative Commons Attribution-Share Alike 3.0 Unported lizentziapean dago. Subject to disclaimers. | ||
| Aitortu: GregBenson from en.wikipedia.org | ||
| ||
| This licensing tag was added to this file as part of the GFDL licensing update. |

|
Baimena duzu dokumentu hau kopiatu, banatu edo/eta aldatzeko GNU Free Documentation License baldintzapean, Free Software Foundationek argitaratutako 1.2 edo ondorengo bertsioan; sekzio aldaezinik gabe, azaleko testurik gabe, eta atzeko azaleko testurik gabe. Lizentziaren kopia dago GNU Free Documentation License izenburudun atalean. Subject to disclaimers. |
Jatorrizko igoera erregistroa
The original description page was here. All following user names refer to en.wikipedia.
- 2004-08-01 16:33 GregBenson 400×400× (28715 bytes) Graph of atmospheric dewpoints across a range of temperatures. I am the author of this figure.
Fitxategiaren historia
Data/orduan klik egin fitxategiak orduan zuen itxura ikusteko.
| Data/Ordua | Iruditxoa | Neurriak | Erabiltzailea | Iruzkina | |
|---|---|---|---|---|---|
| oraingoa | 09:36, 8 urria 2009 | | 400 × 400 (28 KB) | File Upload Bot (Magnus Manske) | {{BotMoveToCommons|en.wikipedia|year={{subst:CURRENTYEAR}}|month={{subst:CURRENTMONTHNAME}}|day={{subst:CURRENTDAY}}}} {{Information |Description={{en|Graph of atmospheric dewpoints across a range of temperatures. I am the author of this figure. It was |
Irudira dakarten loturak
Hurrengo orrialdeek dute fitxategi honetarako lotura:
Fitxategiaren erabilera orokorra
Hurrengo beste wikiek fitxategi hau darabilte:
- ar.wikipedia.org proiektuan duen erabilera
- ba.wikipedia.org proiektuan duen erabilera
- be.wikipedia.org proiektuan duen erabilera
- bn.wikipedia.org proiektuan duen erabilera
- ca.wikipedia.org proiektuan duen erabilera
- cv.wikipedia.org proiektuan duen erabilera
- en.wikipedia.org proiektuan duen erabilera
- es.wikipedia.org proiektuan duen erabilera
- fr.wikiversity.org proiektuan duen erabilera
- hi.wikipedia.org proiektuan duen erabilera
- hr.wikipedia.org proiektuan duen erabilera
- kk.wikipedia.org proiektuan duen erabilera
- mk.wikipedia.org proiektuan duen erabilera
- pt.wikipedia.org proiektuan duen erabilera
- ru.wikipedia.org proiektuan duen erabilera
- sc.wikipedia.org proiektuan duen erabilera
- sh.wikipedia.org proiektuan duen erabilera
- sq.wikipedia.org proiektuan duen erabilera
- sr.wikipedia.org proiektuan duen erabilera
- tt.wikipedia.org proiektuan duen erabilera