Fitxategi:3 phase rectification 2.svg

SVG fitxategi honen PNG aurreikuspenaren tamaina: 397 × 600 pixel. Bestelako bereizmenak: 159 × 240 pixel | 317 × 480 pixel | 508 × 768 pixel | 677 × 1.024 pixel | 1.355 × 2.048 pixel | 624 × 943 pixel.
Bereizmen handikoa (SVG fitxategia, nominaldi 624 × 943 pixel, fitxategiaren tamaina: 120 KB)
Fitxategi hau Wikimedia Commonsekoa da. Hango deskribapen orriko informazioa behean duzu. |
Laburpena
| Deskribapena |
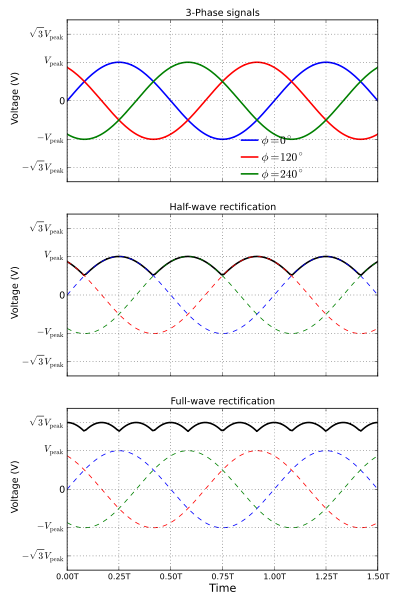
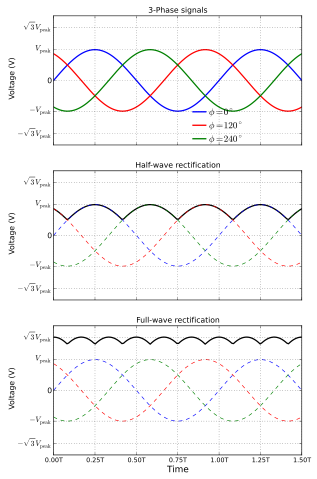
English: Waveforms for a typical 3-phase half-wave and full-wave rectifiers. The top plot shows the individual three phase signals, the middle plot shows the half-wave rectifier output in solid curve and the bottom plot shows the full-wave rectifier output in solid curve. The 'T' in time is the time period of individual signals and is the amplitude of each of the three input signals.
The diagram was created using python, matplotlib and numpy.
Русский: Формы сигналов трёхфазного одно- и двухполупериодного выпрямителей. Сверху - отдельные трехфазные сигналы, средний график - выход однополупериодного выпрямителя сплошной линией, нижний график - выходной сигнал двухполупериодного выпрямителя сплошной линией. T - период, U - напряжения. |
||
| Data | |||
| Jatorria | Norberak egina | ||
| Egilea | Krishnavedala | ||
| Beste bertsioak |
3 phase rectification 2.png
[]
.png:
.jpg:
|
||
| SVG genesis | Fitxategi hau (bektore-irudia) hau Matplotlib-ekin sortu da . | ||
| Iturburu kode | Python code
|


Lizentzia
Nik, lan honen egileak, argitaratzen dut ondorengo lizentzia hauen pean:
Fitxategi hau Creative Commons Attribution-Share Alike 3.0 Unported lizentziapean dago.
- Askea zara:
- partekatzeko – lana kopiatzeko, banatzeko eta bidaltzeko
- birnahasteko – lana moldatzeko
- Ondorengo baldintzen pean:
- eskuduntza – Egiletza behar bezala aitortu behar duzu, lizentzia ikusteko esteka gehitu, eta ea aldaketak egin diren aipatu. Era egokian egin behar duzu hori guztia, baina inola ere ez egileak zure lana edo zure erabilera babesten duela irudikatuz.
- berdin partekatu – Lan honetan oinarrituta edo aldatuta berria eraikitzen baduzu, emaitza lana hau bezalako lizentzia batekin argitaratu behar duzu.

|
Baimena duzu dokumentu hau kopiatu, banatu edo/eta aldatzeko GNU Free Documentation License baldintzapean, Free Software Foundationek argitaratutako 1.2 edo ondorengo bertsioan; sekzio aldaezinik gabe, azaleko testurik gabe, eta atzeko azaleko testurik gabe. Lizentziaren kopia dago GNU Free Documentation License izenburudun atalean. |
Nahiago duzun lizentzia erabil dezakezu.
Fitxategiaren historia
Data/orduan klik egin fitxategiak orduan zuen itxura ikusteko.
| Data/Ordua | Iruditxoa | Neurriak | Erabiltzailea | Iruzkina | |
|---|---|---|---|---|---|
| oraingoa | 17:52, 23 iraila 2011 | | 624 × 943 (120 KB) | Krishnavedala | individual plots are now consistent with each other |
| 19:24, 22 iraila 2011 |  | 624 × 943 (114 KB) | Krishnavedala | final correction, hopefully!! | |
| 19:20, 22 iraila 2011 |  | 640 × 943 (116 KB) | Krishnavedala | corrected Time coordinates | |
| 19:04, 22 iraila 2011 |  | 623 × 943 (115 KB) | Krishnavedala | Corrected the waveforms for the full wave rectification. | |
| 00:06, 1 uztaila 2011 |  | 599 × 944 (175 KB) | Spinningspark | Fixed correct use of italics. Fixed annotation outside boundary of image. Output waveform on top of input waveforms. | |
| 21:29, 30 ekaina 2011 |  | 599 × 944 (111 KB) | Krishnavedala | removed "(sec)" from the x-axis label | |
| 21:27, 30 ekaina 2011 |  | 599 × 946 (111 KB) | Krishnavedala | edits from suggestions in here | |
| 21:51, 17 ekaina 2011 |  | 524 × 874 (142 KB) | Krishnavedala | thinner dashed lines | |
| 21:48, 17 ekaina 2011 |  | 524 × 874 (142 KB) | Krishnavedala | all plots on the same scale to avoid confusion | |
| 19:18, 8 ekaina 2011 |  | 594 × 946 (223 KB) | Krishnavedala | correction in the labels |
Irudira dakarten loturak
Hurrengo orrialdeek dute fitxategi honetarako lotura:
Fitxategiaren erabilera orokorra
Hurrengo beste wikiek fitxategi hau darabilte:
- ca.wikipedia.org proiektuan duen erabilera
- cs.wikipedia.org proiektuan duen erabilera
- el.wikipedia.org proiektuan duen erabilera
- en.wikipedia.org proiektuan duen erabilera
- eo.wikipedia.org proiektuan duen erabilera
- ja.wikipedia.org proiektuan duen erabilera
- th.wikipedia.org proiektuan duen erabilera
- zh.wikipedia.org proiektuan duen erabilera